
Airfield Insights transforms data into real-time, actionable insights to enhance collaboration and drive smarter decisions.
On-demand and customizable analytics power interactive airfield maps, enabling airports and ANSPs to introduce and manage KPIs while identifying areas of continuous improvement to support growth and investment.
Built on a unique digital twin, Airfield Insights captures every movement, transforming it into actionable datapoints for onward reporting, unique non-operational situational awareness, and future resilience.
Airfield Insights delivers immediacy and collaboration through your airport data, allowing operations teams to unlock the full capabilities of their airfield – whether in day-to-day operations, or long-term strategic and master planning.
Trust Airfield Insights by Seardige Technologies, backed by over 15 years of airside efficiency expertise, technology innovation, and data intelligence across airport, airline, and airside operations.
Airfield Insights Features

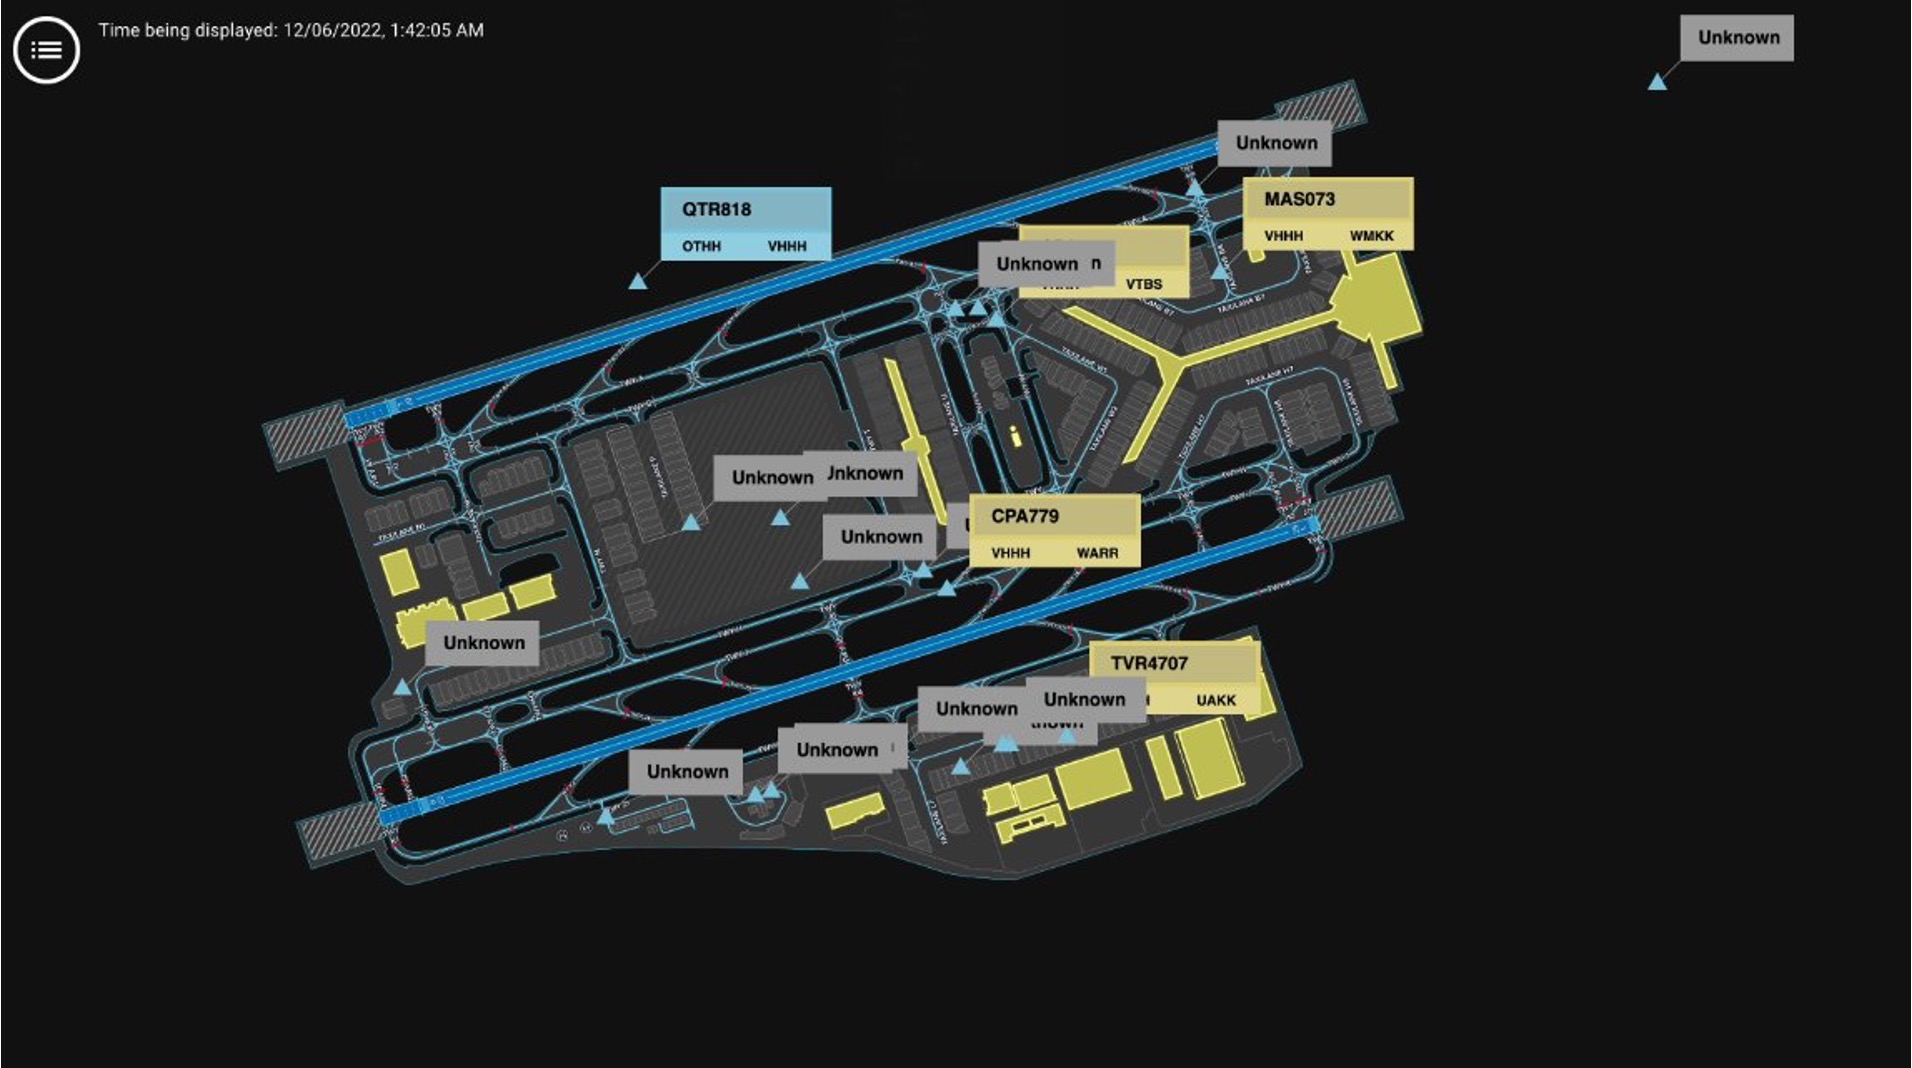
Real Time Display
Customizable airfield view, filtered to display what’s most important to any user type.

Historic Playback
Rewind to a specific date/time for immediate event analysis, lesson learning, training and continuous improvement.

Accessible and Scalable
Immediately accessible on any internet connected device with role-based access across airfield stakeholders.

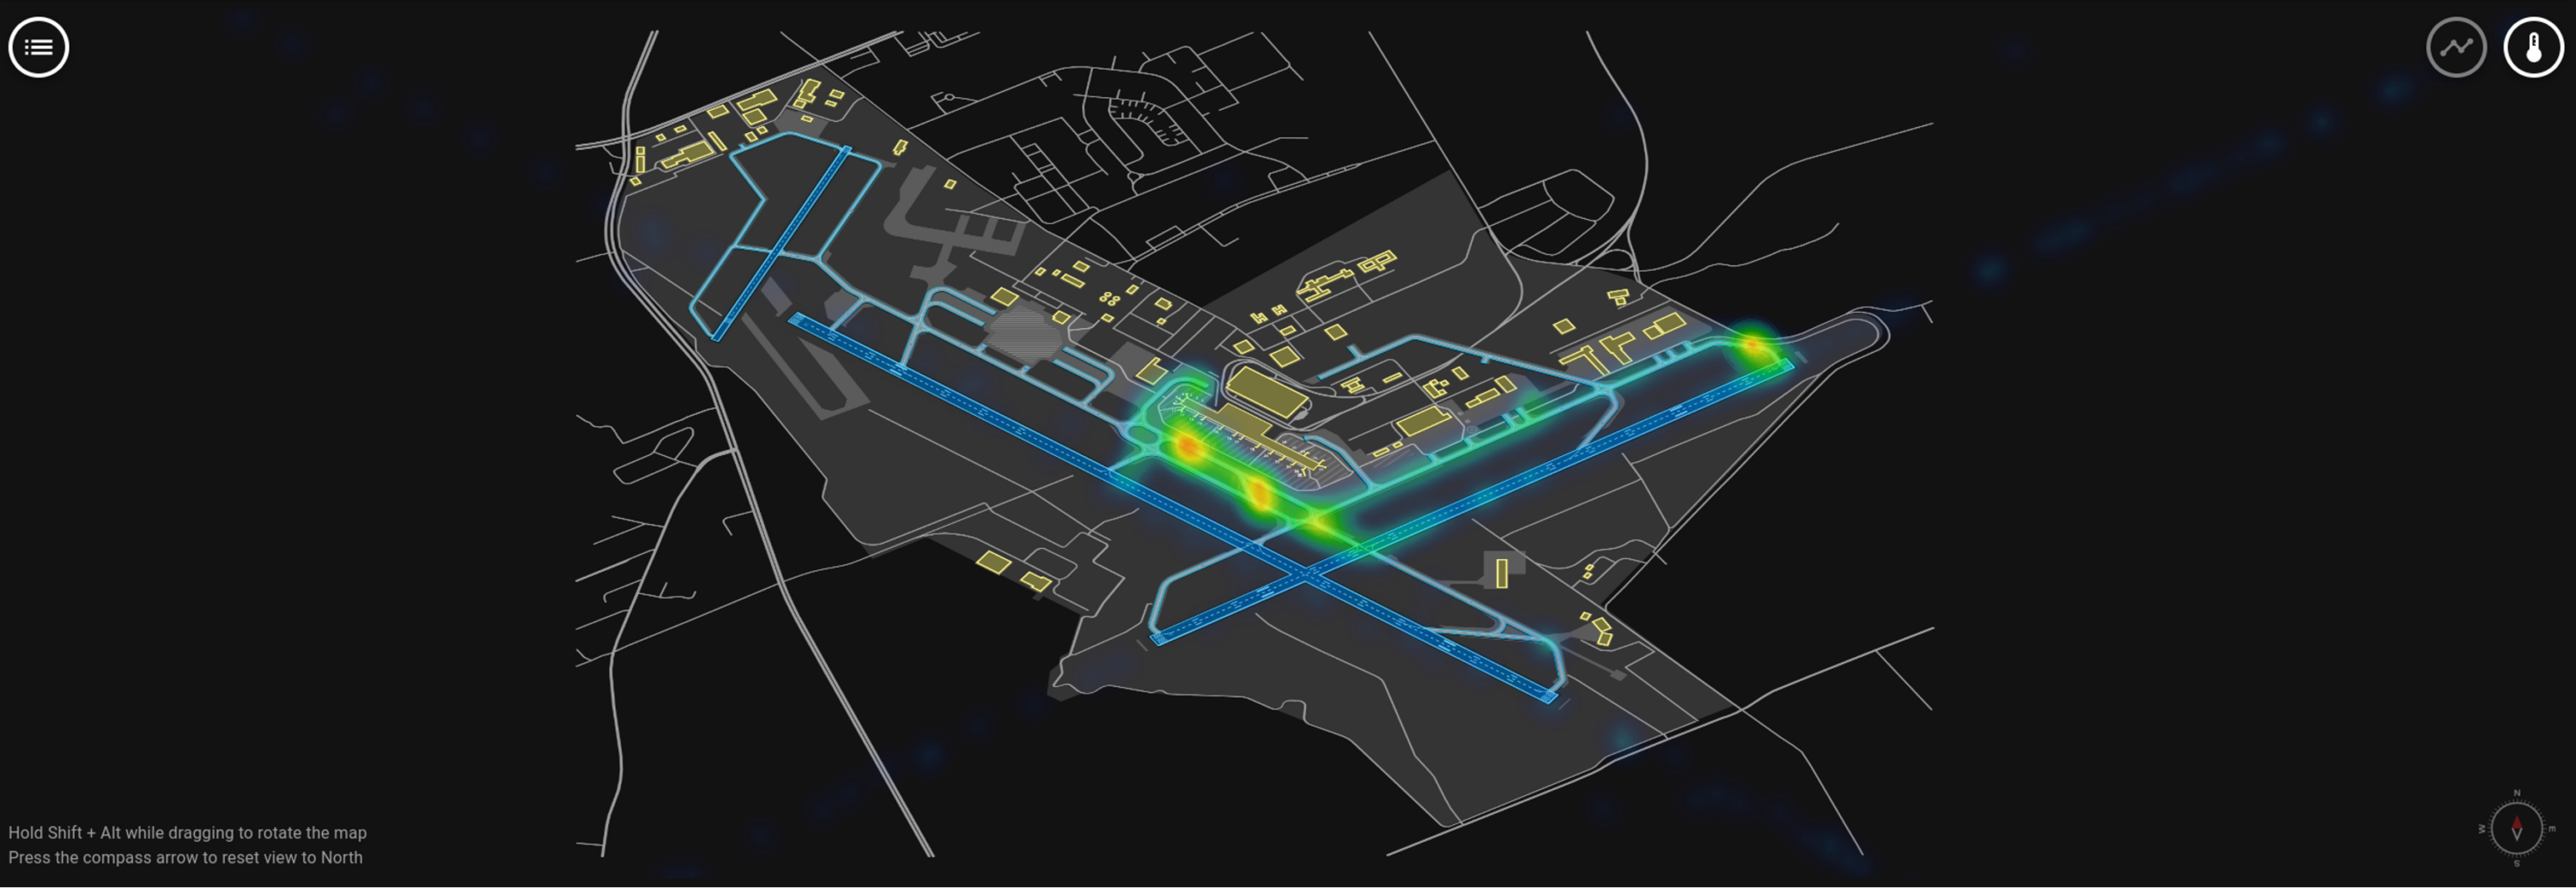
Map Overlays
Visualize your airfield like never before with map overlays displaying taxi routes, hotspots and more.

Interactive Analysis
Dynamic, filtered charts by airline, aircraft type, or airfield asset for total reporting control on demand.

Digital Twin
Performance stats based on a unique, purpose built digital model of all your airport infrastructure, ensuring flexible, dynamic and detailed reporting across every movement, every second.
Proactive IROP Alerting
Extend your decision-making window to proactively manage emerging issues before they turn into bigger problems, delays, interruptions, and incidents.
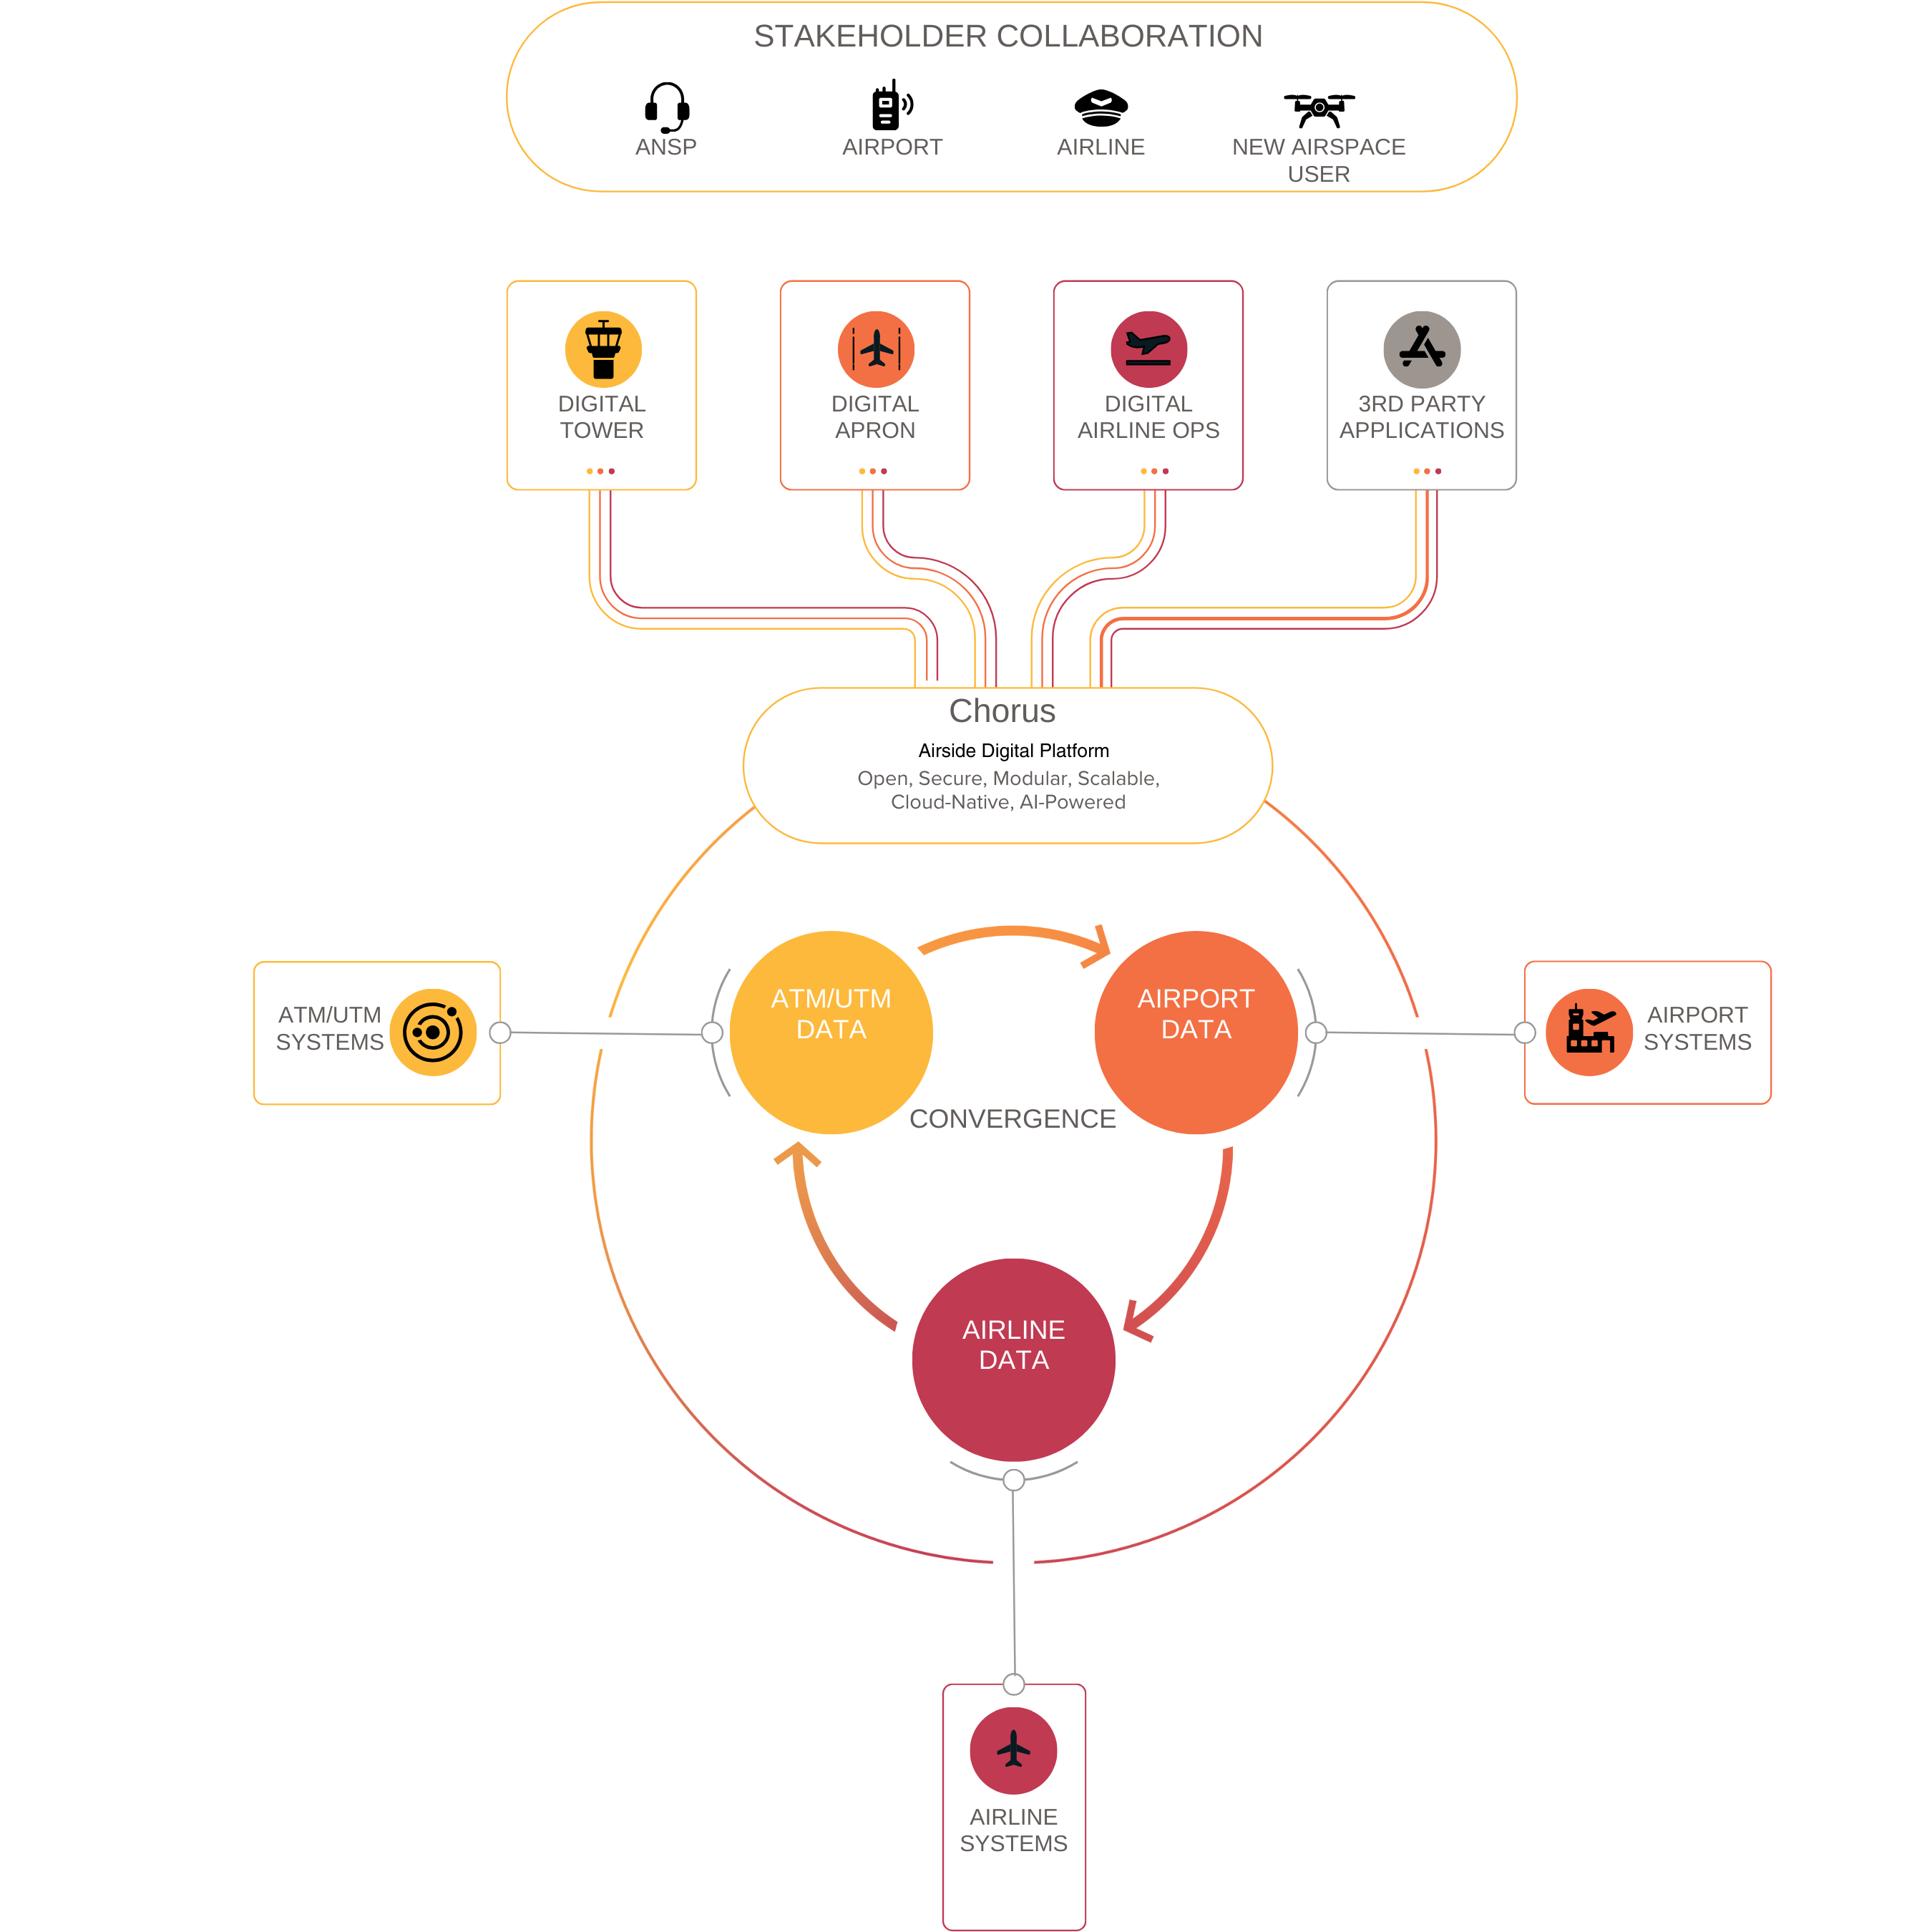
Optimizing Airfield Operations with the Searidge Chorus Platform
Airfield Insights runs on Chorus, our cloud-native, non-proprietary digital platform. Chorus is an open, secure, scalable platform that integrates diverse data sources and technologies, eliminating operational silos to enable real-time decision-making and situational awareness across your airport operations.
Designed for scalability and flexibility, Chorus optimizes airside operations by integrating diverse data sources including radar, electronic strips, cameras, and networked sensors.
Airfield Insights is deployed as a cloud-native web application accessible on any internet-connected device, ensuring efficient onboarding and unified data reporting. Whether deployed on-premise, in a private cloud, or as a fully managed SaaS solution, Chorus’s integration capabilities eliminate operational silos, enhance cross-system collaboration, and maximize the value of your airport data.
Data-Driven Decisions at Your Fingertips
In today’s complex aviation landscape, airports face numerous challenges:
- Increasing passenger volumes and operational pressures
- Limited airside infrastructure capacity
- Rising costs and environmental concerns
- Demand for improved efficiency and passenger satisfaction
By leveraging Airfield Insights automated data analytics, airports can identify bottlenecks, streamline processes, and enhance resource allocation routinely. This data-driven approach enables better slot management, maximizes runway throughput, and ensures consistent airline operations.
The Analytics Display with advanced filtering options provides you with the tools and data needed to monitor, analyze, and optimize operational performance with more effective, targeted stakeholder collaboration and engagement.
Airfield analytics cover datapoints across flexible modules related to runway, ground, environmental and safety, aligned to global airport analytics trends and focus areas, ensuring consistent measurement and prioritization.
How Airfield Insights Benefits You
24/7/365 Access to Real-Time Data
Web-accessible for ground, tower, and back-office teams to enable informed tactical and strategic decisions

Digital Twin
Near real-time situational awareness of the airfield operation for all stakeholders.

Streamlined, Optimized Operations
Seamlessly aggregate data from multiple sources, centralizing and correlating data for streamlined analysis and reporting.

Proactive Airfield Management
Extended decision-making window with early alerts to manage emerging IROPs

Data-Driven, Continuous Improvement
Identify trends based on historic data analysis and comparisons, enabling continuous improvement activities

Collaborative Airport Management
Enables airport management from a central operations control center (OCC, APOC, IOC)

Action-Oriented Stakeholder Collaboration
Improved stakeholder collaboration through consistent, measurable data, charts and historic event playback of a scenario

Integrated Support
Trust in the Searidge team to provide thorough and responsive product support and training
Are you ready to transform your airfield performance and operations?
It’s time to harness the power of data visibility to measure, analyze, improve, and optimize every aspect of your operations.
Put an end to costly data analysis, delays, and blindspots.